Working principle & Instrumentation
 |
| PSD instrumentation |
Pore size distribution analysis is used to determine the range of pore sizes within a material. This information is crucial for understanding the material's properties, especially in fields like material science, catalysis, and filtration.
PSD provides data on the distribution of pore sizes, indicating the variety of pore dimensions within a material. This information is vital for assessing how easily fluids can move through the material and its suitability for specific applications.
Various techniques are used for PSD analysis, including gas adsorption methods (often with instruments like BET analyzers (works on the BET theory principle ),
The BET (Brunauer, Emmett, and Teller) theory is commonly employed, which assumes the formation of a monolayer (as Langmuir theory) or multilayer of gas molecules on the surface.
Mercury intrusion porosimetry (pore structure diameter volume etc), and nuclear magnetic resonance (NMR) methods. Each technique offers different insights into pore size distribution.
The principle varies based on the technique employed. In gas adsorption methods like BET, the principle involves the adsorption of gas molecules onto the surface of the material. In mercury intrusion porosimetry, mercury is forced
into the pores, and the intrusion pressure is related to pore size. NMR methods rely on the interactions between nuclear spins and the material's structure to infer pore size distribution. Each method exploits different physical principles to
provide information about the material's porosity.
Sample Preparation Sample preparation depends on the technique used. For gas adsorption methods, the material is typically degassed to remove adsorbed gases. In mercury intrusion porosimetry, the sample is impregnated with mercury. NMR methods require specific sample handling for accurate results.
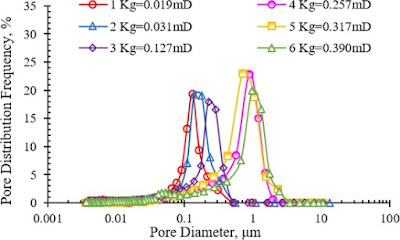
Results interpretation PSD results are often presented as a plot showing the
percentage of pores within specified size ranges. The shape of the distribution curve provides insights into the homogeneity of the pore size within the material.

-01.jpeg)

%20(1).jpeg)