Working principle & Instrumentation

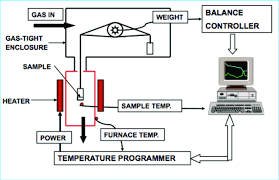
TGA instrumentation
Thermal analysis are Techniques in which a physical property of a substance is measured as a function of temperature whilst the substance is subjected to a controlled temperature programme certain techniques lie in this here we discuse TGA and DTA in detail.
Thermogravimetry (TGA) is a technique in which the mass of a substance is measured as a function of temperature while the substance is subjected to a controlled temperature programme. The record is the thermogravimetric or TG curve or graph the mass should be plotted on the ordinate decreasing downwards and temperature (T) or time (t) on the abscissa increasing from left to right.
A thermobalance is used for weighing a sample continuously while it is being heated (in a given enivornement, air, N2, CO2, He, Ar, etc ) or cooled. The heating rate is the rate of temperature increase, which is customarily quoted in degrees per minute (on the Celsius or Kelvin scales). The heating or cooling rate is said to be constant when the temperature/time curve is linear.
The initial temperature, Ti, is thattemperature (on the Celsius or Kelvin scale) at which the cumulative-mass change reaches a magnitude that the thermobalance can detect. The final temperature, Tf, is that temperature (on the Celsius or Kelvin scale) at which the cumulative mass change reaches a maximum. The reaction interval is the temperature difference between Tf and Ti as defined above. TG measures changes in sample mass, indicating processes such as decomposition, oxidation, or phase transitions. DTA can perform with it for physical property of substance is measured as a function of temperature at controlled temperature programme.
Sample Preparation Samples are usually finely ground and placed in a sample holder. It's crucial to have a representative sample and to account for factors like sample size and packing density, as they influence the thermal behavior.
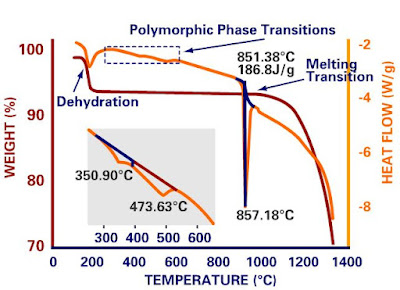
Results interpretation In TG, weight loss or gain is observed as a function of temperature, providing information about processes like decomposition or oxidation. Plateau A plateau is that part of the TG curve where the mass is essentially constant. And decline line in grapgh shows decrease in mass as function of temperature.

TGA graph
-01.jpeg)

%20(1).jpeg)